Someone on your team announces that last week’s campaign had a great reply rate. Before you celebrate, ask one question: how many of those replies were people asking to be left alone?
Reply rate is the most quoted number in cold email and the least useful one. It treats every reply as equal, it can be pushed up by copy that provokes rather than persuades, and it says nothing about whether any of those replies turned into a conversation with a company that can buy from you. Small teams that steer by it end up optimising for noise.
The better primary number is interested replies per hundred people contacted, with companies in conversation as the number you report to whoever asked. Below that sit the guardrails that keep your sending healthy. This article explains why reply rate misleads, what to replace it with, and how to read a campaign’s statistics so the next one improves.
What reply rate actually counts
Take a plain definition: replies divided by emails delivered. Now list what lands in the numerator.
- A prospect who wants to talk.
- A prospect who says “not now, try me in the autumn”.
- A prospect who says “no, and take me off your list”.
- An out-of-office autoresponder.
- A colleague forwarding the email and asking who you are.
- A bounce notice from a mail server.
- Someone angry enough to write two paragraphs about it.
Four of those seven are not good news, and two of them are not people at all. A reply rate that rises because you sent to a list riddled with stale addresses (more autoreplies, more bounces) or because you wrote something provocative (more “no thanks”) is a reply rate that rewards you for getting worse.
The fix is not a better benchmark. It is to stop treating replies as one bucket.
Split the bucket first
Every reply belongs in a class. The set that works for most teams is short: Interested, Maybe later, Not interested, Autoreply / Out of office, Bounce, Unsubscribe request, Other. Once replies are sorted, reply rate dissolves into several numbers with different meanings.
Seegnals classifies incoming replies into exactly these classes automatically and lets you correct a class with one click. The campaign Stats tab then shows Responded and Interested as separate tiles, with the By outcome row (Sent, Opened, Clicked, Replied, Autoreplied, Bounced, Opted out) underneath. You can read the same split by hand in any inbox; the point is to insist on the split before you quote a number.
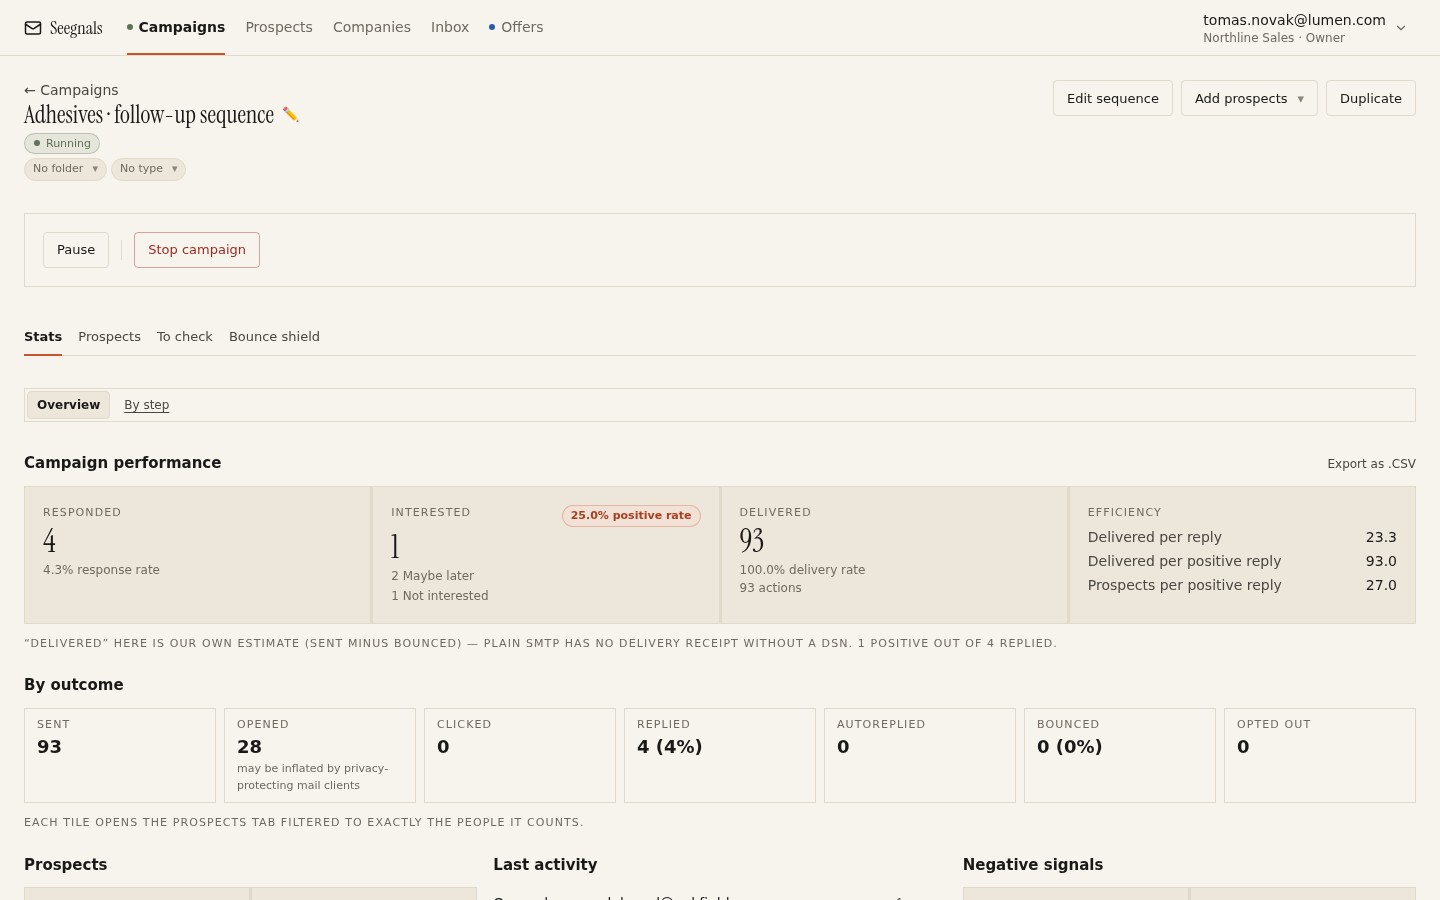 Responded and Interested sit side by side on purpose: the gap between them is the part of your reply rate that was never good news.
There is a longer piece on how to sort replies into Interested, Maybe later and Not now if you want the decision rules.
The primary number: interested replies per hundred contacted
Once replies are split, one class is worth steering by: Interested. Express it as a count per hundred people contacted rather than as a percentage of delivered, for two reasons.
First, “per hundred contacted” includes the people you failed to reach. If a fifth of your list bounced or was held back as unverifiable, that failure belongs in the denominator. A metric that quietly excludes it flatters a bad list.
Second, small teams run small campaigns. Percentages on a list of eighty people swing wildly with a single reply. A count per hundred keeps the number honest about its own scale: two interested replies from eighty people is two interested replies, and you should plan around it as such.
Use this number to compare segments, sequences and variants. Do not compare it against anything you read on the internet; you do not know how those numbers were counted.
The number to report: companies in conversation
Interested replies measure the campaign. They do not measure the pipeline. Three interested replies from three people at the same company are one opportunity, and a company where one person said “not now” while a colleague said “let’s talk” is in conversation regardless of the first reply.
For anyone above you who asks how outbound is going, the useful answer is the number of companies currently in active conversation, and how many of them entered that state this month. That is a number a founder or a sales lead can act on: it tells them how many discovery calls are coming, which is what they wanted to know when they asked about the reply rate.
This is why the company is the right unit for outbound reporting. In Seegnals every prospect belongs to a company by email domain, and the company card shows all people at that company with one timeline of events across every campaign. The dashboard lists the hottest companies, so the report writes itself: open the dashboard, count.
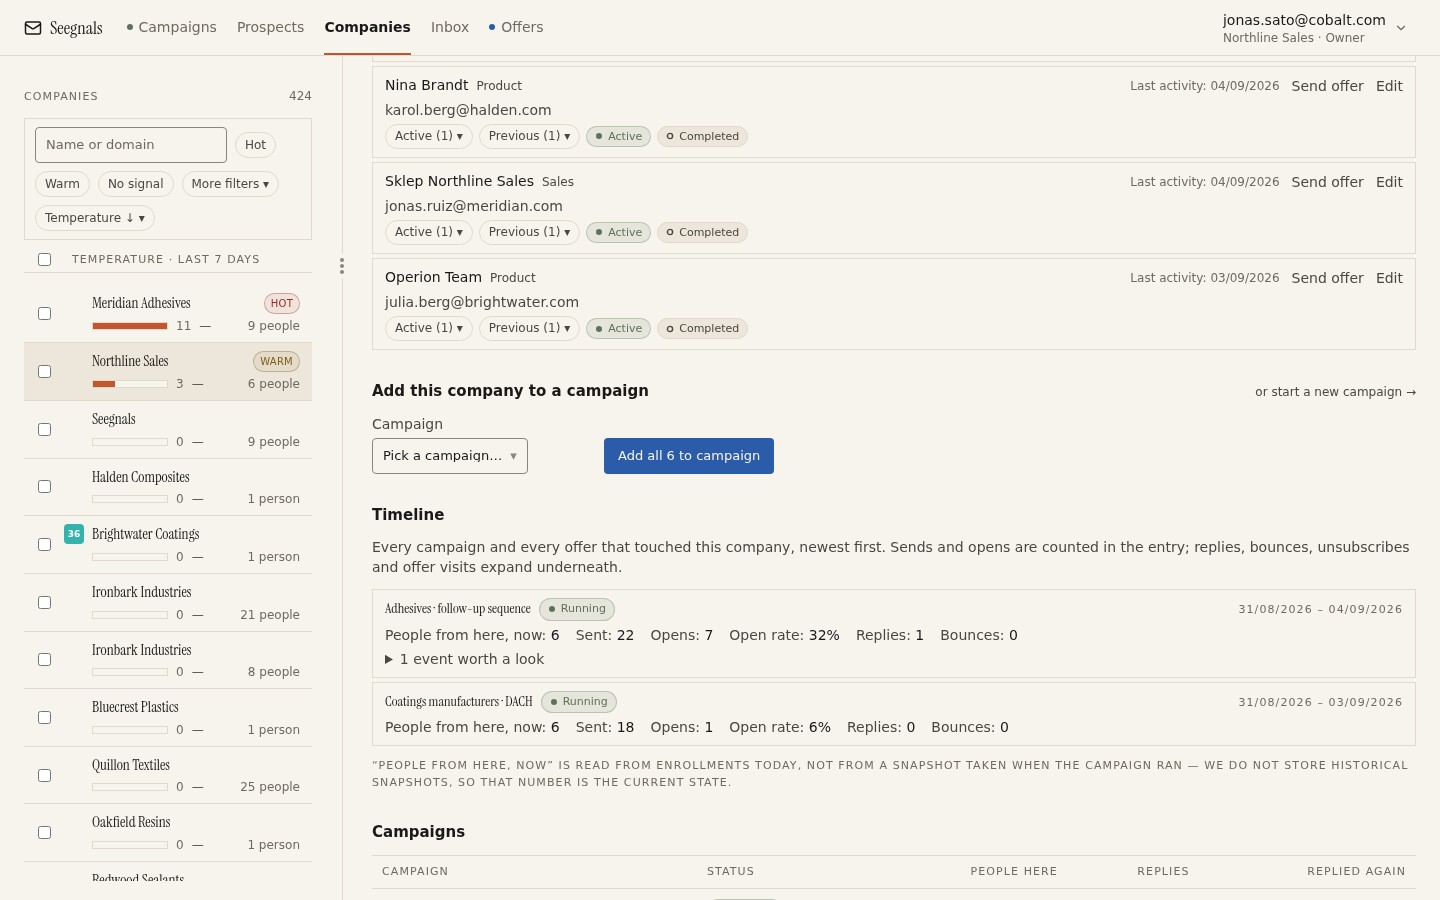 One company, several people, one timeline: this is the view that tells you whether an account is in conversation, which no reply rate can.
Guardrails: numbers that should stay low
Below the primary number sit the metrics that protect your ability to send at all. These are not goals. Nobody should be praised for a low bounce rate; the bounce rate should simply be low.
- Bounced. Hard bounces are dead addresses. A rising bounce count is the fastest route to a damaged sending domain. Seegnals pauses a campaign on its own when bounces cross a threshold you set (the bounce shield) and notifies you, so the guardrail has teeth. There is a separate article on what bounce rate is safe.
- Opted out. Unsubscribe requests and clicks on the unsubscribe link. A cluster on one step points at that step’s copy.
- Unknown addresses. The share of imported addresses that verification could not confirm, including catch-all domains. This is a list quality signal; if it is high, the problem started before the campaign.
- Autoreplied. Many out-of-office notices suggest bad timing (holiday season, a trade show week) or a list that has not been refreshed.
Watch these on every campaign. When one moves, stop and find out why before you look at anything else.
Diagnostics: per step and per variant
Campaign totals hide problems; step-level numbers reveal them. Two examples.
If interested replies arrive mostly from step one and step two while step four collects unsubscribes, the sequence is too long for that segment. If opted-out clusters on step three specifically, look at step three’s copy before the sequence length. The article on how many follow-ups to send covers the decision.
Variant comparison is the other diagnostic. When a step has A/B variants of subject or body, the comparison table shows each variant’s outcomes side by side. Read it for interested replies first and everything else second, and remember that with small lists the difference between variants may be one person. There is more on A/B testing subject lines and variants elsewhere.
Both views live in the Stats tab, and clicking any tile opens the Prospects tab filtered to those people, so “who exactly replied to step three” is one click. You can export the whole thing as CSV if you would rather work in a spreadsheet anyway.
A note on opens and clicks
Open rate deserves a paragraph of its own because so many people still lead with it. An open is recorded when a tracking pixel loads. Apple Mail Privacy Protection loads it whether or not a human looked, and several corporate clients block images entirely. The absolute number is therefore neither a ceiling nor a floor on real attention. Seegnals shows open rates with a note about this inflation for exactly that reason, and only tracks opens and clicks at all through a tracking domain you own; without a verified one, the interface simply says opens are not tracked.
Use opens for one thing: comparing two variants of the same step, sent to the same segment, in the same window. Even then, treat a small gap as no gap.
What to do this week
- Take your last finished campaign and split its replies into the seven classes by hand or with the classifier. Write down interested replies per hundred contacted. That is your baseline.
- Count companies currently in conversation and how many entered that state from this campaign. Use that number the next time anyone asks how outbound is going.
- Record the four guardrails (bounced, opted out, unknown, autoreplied) for the same campaign, and set a bounce threshold that pauses the campaign automatically.
- Open the per-step view and note which step produced the interested replies and which step produced the opt-outs. Decide on one change to the sequence.
- Remove reply rate from any dashboard or weekly message where it stands alone. If it must stay, put Interested next to it.