A campaign finishes and the Stats tab fills with tiles: Sent, Delivered, Opened, Clicked, Replied, Bounced, Opted out. They all look like facts. They are not equally solid. Some of them are close to a measured count. Some are an estimate dressed up as a number. Reading the tab well means knowing which is which before you draw a conclusion from any of it.
The short version: Delivered tells you what left your mailboxes without an obvious rejection, which is an estimate of reach, not proof of arrival in an inbox. Opened is an upper bound, inflated by mail clients that fetch images before anyone looks. Replied is the tile closest to the truth, because it took a person, or at least a mail server, to produce it. Everything else on the page sits somewhere between those three in how much you should trust it.
This article walks the tiles in that order of trust, explains what each one can and cannot prove, and shows how to read the row as a whole instead of picking whichever number looks best that week.
Delivered is an estimate, not a receipt
“Delivered” sounds final. What it actually records is that a receiving mail server accepted your message during the SMTP conversation instead of rejecting it. That is a real event and worth tracking, but it is one step removed from what you actually want to know, which is whether a person could have seen the message.
A server can accept a message and then file it straight into spam, a promotions tab, or a quarantine folder nobody checks. None of that shows up as a failure. From your side, the message was delivered. From the recipient’s side, it may never surface. This is why deliverability work does not stop at “did it bounce”: it includes the sending reputation and authentication that decide where an accepted message lands, covered in SPF, DKIM and DMARC for cold email senders.
The honest way to use the Delivered tile is as a floor, not a target. It tells you how many messages did not fail outright. A hard bounce is the clearest negative signal you get, and it is worth reading on its own terms rather than folding into a vague sense of “delivery”. The codes behind a bounce, and which ones mean the address is truly dead, are explained in bounce codes explained, and the threshold for when a bounce rate should worry you is in what bounce rate is safe for cold email.
Opened is an upper bound
Open tracking works by loading a small image at a unique address, and logging a request as an open. The trouble is that several mail clients, Apple Mail chief among them, can fetch that image automatically when a message arrives, before a human has looked at anything. The tracker cannot tell a pre-loaded request from a real one, so it counts both.
The result is not noise in both directions. It is inflation in one direction only: the Opened tile can only be equal to or higher than the number of people who actually looked, never lower. That makes it an upper bound. If Opened reads forty on a campaign of a hundred, you know that at most forty people saw the message, and the true number could be much smaller.
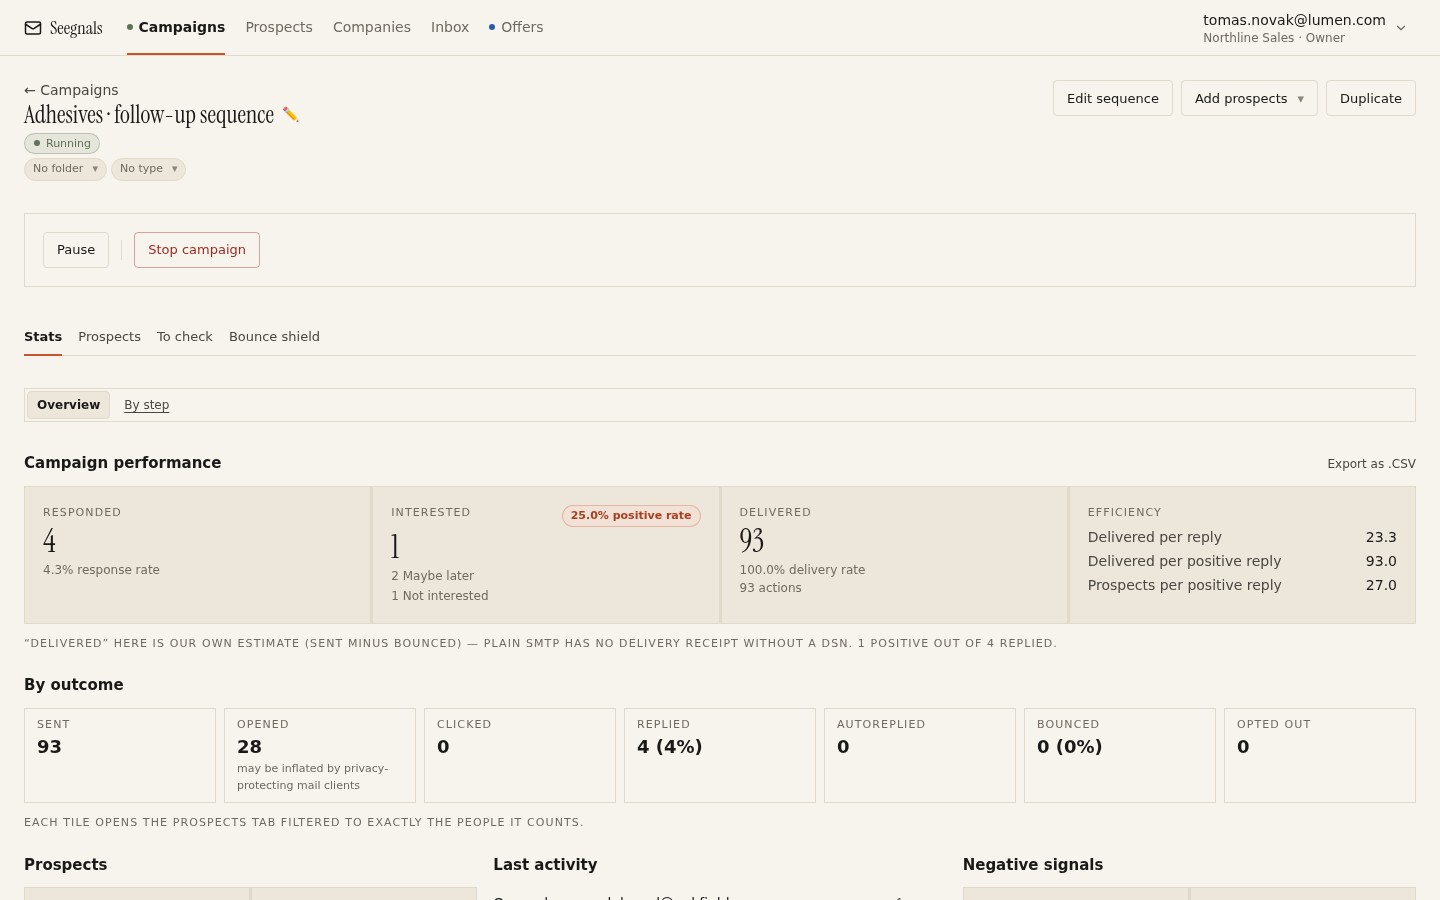 Delivered, Opened and Replied sit on the same row and read like the same kind of number. They are not.
This is worth understanding as a mechanism, not just a caveat, and there is a full explanation of how Mail Privacy Protection works and which comparisons survive it in open rates after Apple Mail Privacy Protection. Seegnals shows open rates with a note about the inflation for exactly this reason: hiding the number would remove the one legitimate use, comparing two variants sent to the same list in the same window, which is the subject of A/B testing cold email subject lines and variants.
Clicked sits closer to the truth, with one asterisk
A click requires an action a pre-loaded pixel cannot fake: someone, or something, followed a link. That puts Clicked well above Opened in reliability. The asterisk is that link scanners run by corporate security tools sometimes follow links before a message reaches the inbox, which can register a click nobody made in the ordinary sense.
Clicks are only tracked at all through a tracking domain you own and verify; without one, Seegnals does not pretend to measure them and says so in the interface rather than showing a zero that looks like a real number. That design choice matters here: a tile that quietly shows nothing when it has nothing to show is more trustworthy than one that always shows something.
Replied is where the truth starts
A reply is the first tile on the page that could not have happened without a person, or at least a server, composing and sending something back. That is a categorically different kind of evidence from an image loading. It is why Replied, and the Interested class within it, deserve to sit above everything else when you judge a campaign.
Replied is not automatically good news on its own: it includes out-of-office autoreplies, unsubscribe requests and the occasional angry message, alongside the replies you wanted. Seegnals classifies every reply automatically into Interested, Maybe later, Not interested, Autoreply, Bounce, Unsubscribe request and Other, and a classified reply stops the sequence for that person. Splitting the bucket this way, and why the raw reply count is a poor headline number on its own, is the full subject of reply rate is the wrong north star and sorting replies into Interested, Maybe later and Not now.
The progress bar reflects this hierarchy too: a prospect who replies counts as done for that campaign even if later steps in the sequence never send. Once someone has produced the one signal that required them to act, there is nothing left to prove.
Read the row as a funnel, not a scoreboard
The By outcome row (Sent, Opened, Clicked, Replied, Autoreplied, Bounced, Opted out) is easiest to misread as seven independent scores. Read it instead as a funnel that narrows from left to right, and look for the stage where the drop is larger than the stage before it.
A gap between Sent and Delivered points at your list or your sending domain: dead addresses, or a domain with a reputation problem. A gap between Delivered and Opened is mostly meaningless on its own, given the inflation above, unless it is unusually small even accounting for that, which can point at spam placement. A gap between Opened (or Clicked, where you have it) and Replied is where copy, offer and targeting live: people saw something and did not act on it.
Per-step numbers show where in the sequence the funnel actually narrows, which the campaign total hides.
Bounced and Opted out are not part of the funnel; they are guardrails that should stay low regardless of everything else. A rising Bounced count is the fastest route to a damaged sending domain, which is why the bounce shield pauses a campaign automatically once bounces cross a threshold you set, with a notification so you find out immediately rather than at the end of the campaign.
Per step, per variant, not just the total
A campaign total can hide a problem that a step-level view reveals in seconds. If step one produced most of the interested replies and step three produced most of the unsubscribes, the total tells you neither of those things; the per-step statistics do. The same applies to A/B variants of a step’s subject or body: the comparison table shows each variant’s outcomes side by side, and it is worth reading Replied first and Opened last, for the reasons above.
Clicking any tile in the Stats tab opens the Prospects tab filtered to exactly the people behind that number, which turns “who replied to step two” from a guess into a list.
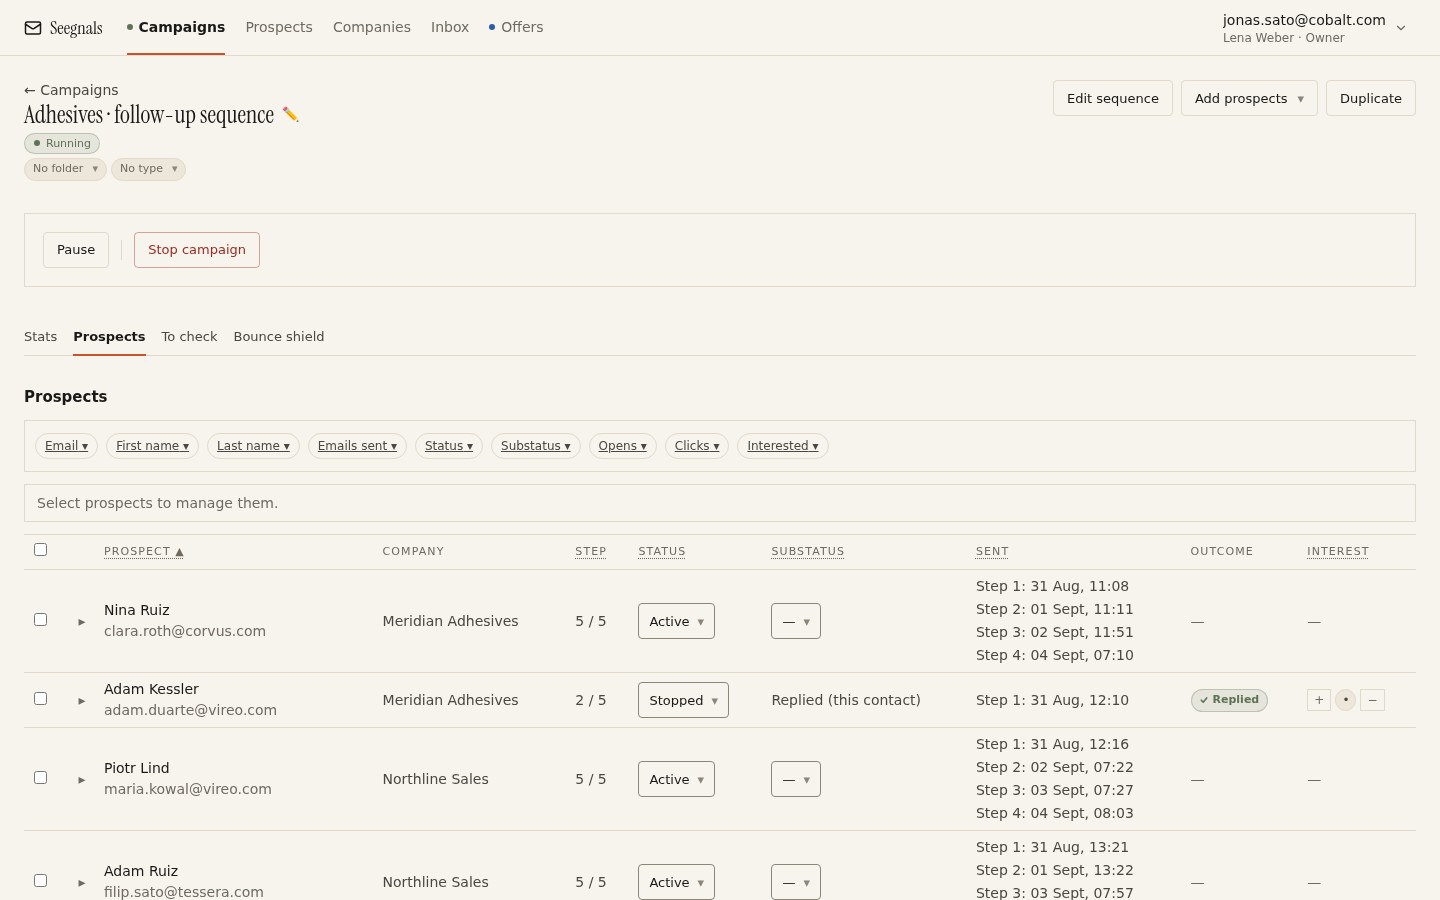 A tile is a count until you click it. Behind it is always a list of specific people, which is worth checking before you trust the count.
If you would rather work in a spreadsheet, the same statistics export as CSV, so nothing here requires staying inside the product to verify.
What to do this week
- Open your last finished campaign and note Delivered, Opened and Replied side by side. Say out loud which one you would bet money on and which one you would not.
- Find the biggest gap in the By outcome funnel for that campaign, and decide whether it points at your list, your sending domain, or your message.
- Click through the Replied tile to the filtered prospect list and read three of the actual replies, not just the count.
- Check the per-step breakdown for the same campaign and identify which single step produced the most interested replies.
- Stop reporting Opened as a headline number in any weekly update. If it stays on the page, put Replied next to it so nobody reads one without the other.